
POSTERIOR · MLB RESEARCH

MLB player prop model

Player props,
priced like probabilities.

Posterior does not run one generic projection across every prop. Each market family gets its own probability head — a beta-binomial for the hits ladder, a negative binomial for pitcher strikeouts, a compound distribution for total bases — and each pick is graded against the no-vig market before it can publish. The settled results, split by family, are on this page.

Hits ladder

Beta-binomial

1+, 2+, and 3+ hits are priced from one posterior count distribution, not three guesses.

Strikeouts

Neg. binomial

Pitcher K ladders carry an explicit dispersion parameter for honest game-level variance.

Total bases

Compound

Singles through homers are convolved per plate appearance into a full bases distribution.

Season-to-date

Win rate by prop market family

Audited season record

Each figure below is the settled win rate of official published picks in that market family — the exact consumer-facing grouping served by the public accuracy API, never a hand-picked split. Brier score sits beside the hit rate because a market can win often and still be priced lazily; the score punishes overconfident probabilities. Families disappear from this panel when there is no graded population rather than publishing a hollow zero. The full breakdown lives at /mlb/accuracy.

Season ROI (all markets)

+3.7770%

Flat 1u return over 2156 priced rows — every market family, wins and losses together.

Record window: season start to Jun 6, 2026. Win rate alone is not the claim — calibration and price capture are audited on the same page.

01 / Intent

Hits

Beta-binomial hit rates

A batter's per-plate-appearance hit rate is treated as a posterior, not a batting average: a league-and-role prior is updated with the hitter's observed hits and opportunities, so a hot week moves the estimate less than a full season does. That posterior feeds a beta-binomial count distribution over the day's expected plate appearances — which is set only after the lineup slot is known — and each threshold (1+, 2+, 3+ hits) reads its probability straight off that one distribution. Exact-threshold calibration then adjusts each rung of the ladder on its own track record.
Strikeouts

Negative-binomial K counts

Strikeout props are count data with real variance, so the K head blends a pitcher's season rate, recent form, and the opponent's team K rate — each shrunk toward its league prior by sample size — then adjusts for whiff rate, chase rate, expected batters faced, workload, park, and plate umpire. The result is a negative-binomial distribution whose dispersion parameter decides how wide a pitcher's plausible game is. The over/under ladder at 3.5 through 9.5 is priced from that full distribution, which is why two pitchers with the same mean projection can get different prices.

Total bases

A compound bases distribution

Total bases are a convolution problem: per-plate-appearance rates for outs and walks, singles, doubles, triples, and home runs are combined across the same plate-appearance distribution used by the hits head, producing a probability for every possible bases total. Alternate lines like 2+ total bases are read off the accumulated distribution instead of a normal approximation, so extra-base power shows up as a fat right tail rather than a bumped average.

Promotion

Challengers earn the chair

New model heads do not ship on a hunch. A challenger runs in shadow first — its probabilities are recorded against the same slates without affecting a single published pick — and it can only take over a market when its out-of-sample evidence beats the incumbent's under the monitored promotion gates. Until then the official probability keeps coming from the current head, and the challenger's track record stays diagnostic-only. The family figures above therefore describe heads that survived that process, not whichever idea looked best in a notebook last week.

02 / How it works

  1. Step 01

    Estimate true probability

    The market-specific head produces the probability: beta-binomial for hits, negative binomial for strikeouts, compound convolution for total bases, with matchup and game-context inputs at the player level.

  2. Step 02

    Remove market noise

    Book prices across allowlisted sportsbooks are converted into a no-vig consensus, so the model is compared against a fair market baseline rather than one book's margin.

  3. Step 03

    Score the edge

    A prop becomes a candidate only when the gap between model probability and market probability is large enough, at a fresh quote, in a market deep enough to trust. Most generated rows never publish.

  4. Step 04

    Settle, then recalibrate

    Resolved rows feed the public ledger and the exact-threshold calibration tables. A rung of the ladder that keeps missing its prices gets its calibration adjusted on evidence, not on narrative.

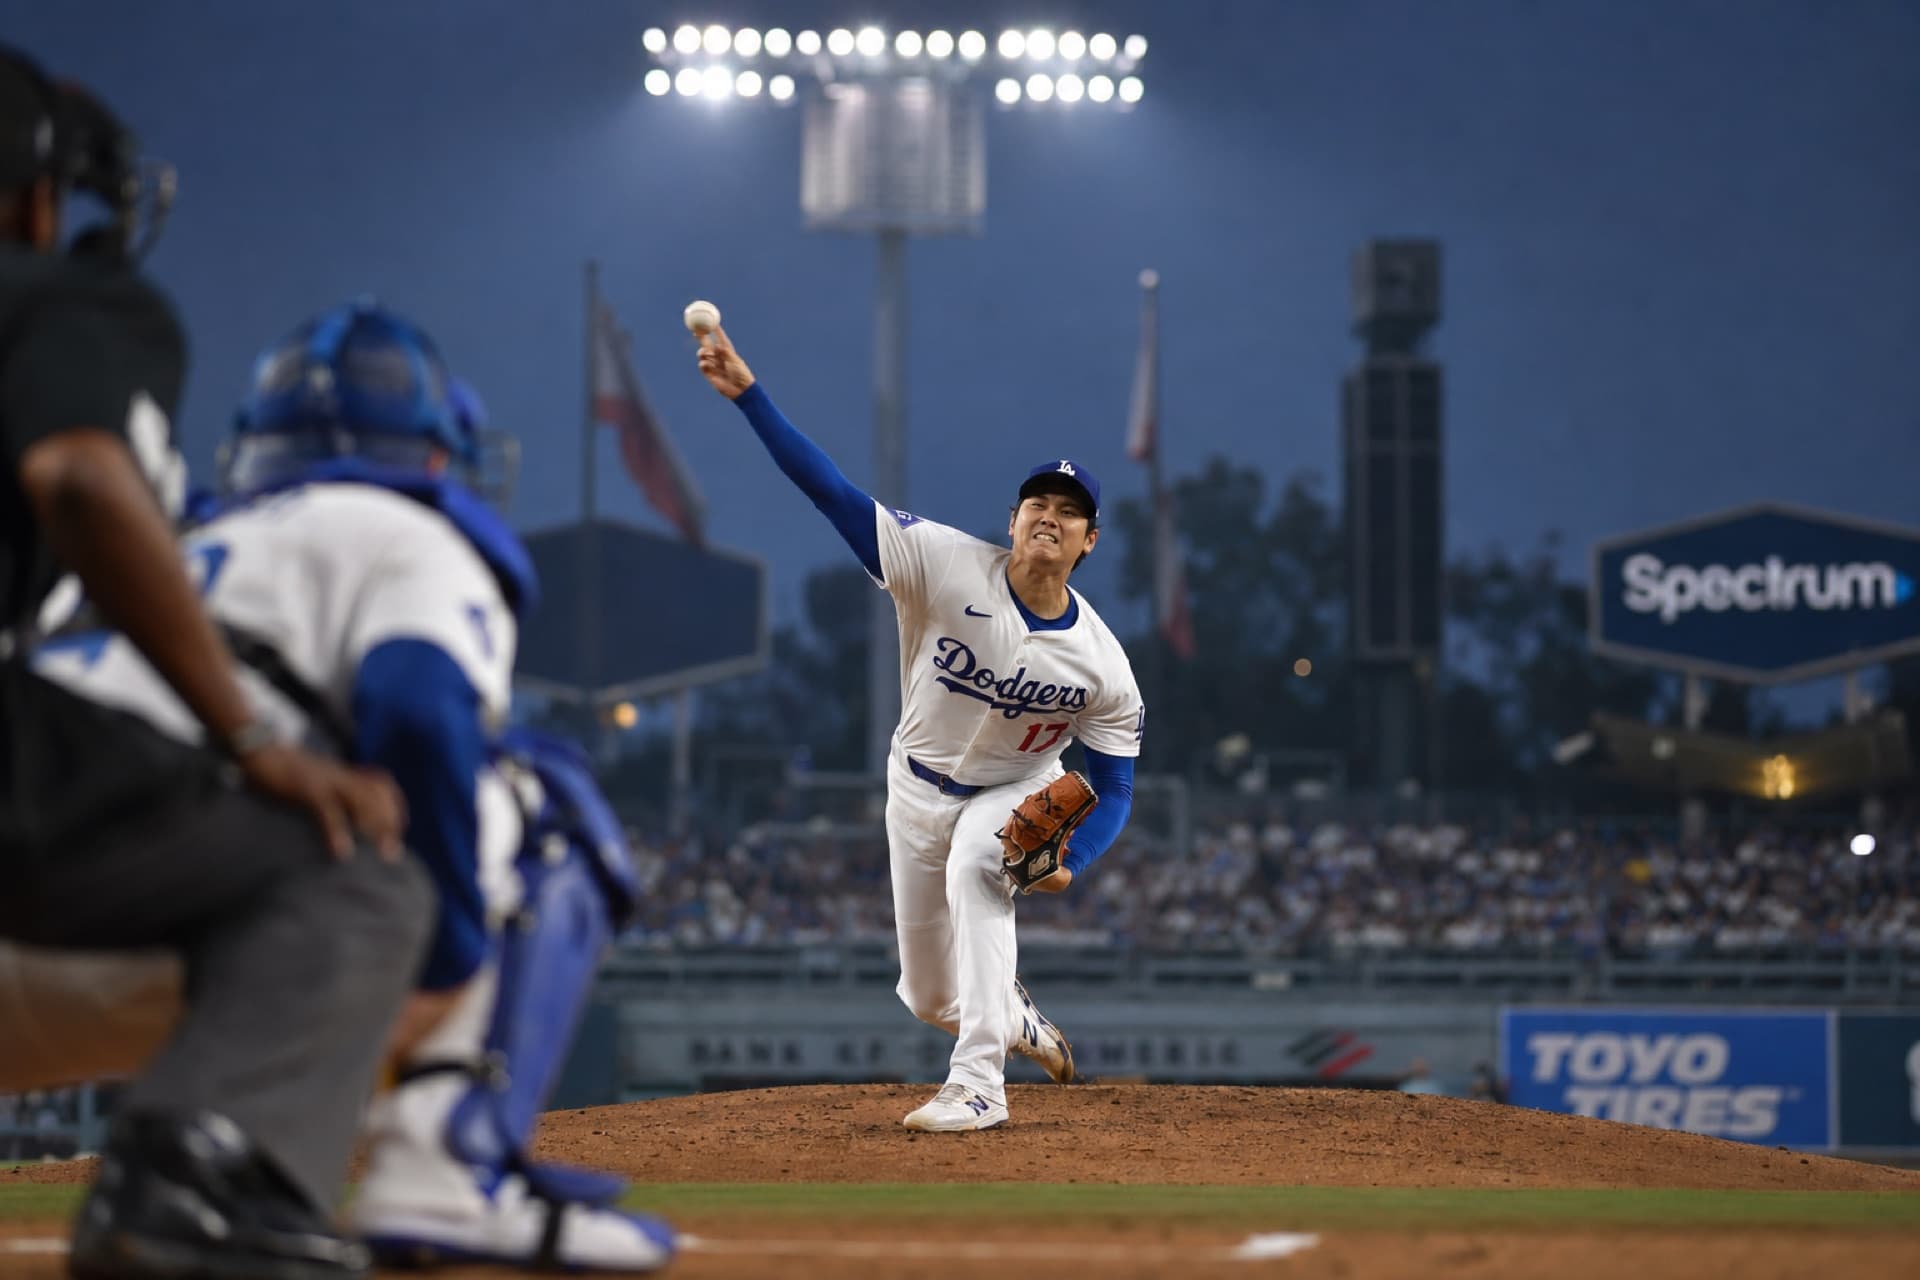
Shohei Ohtani pitching from the mound

Public proof

The market matters as much as the projection.

A high raw probability can still be a bad pick if the line is already priced correctly.

03 / Questions

Which MLB player props does Posterior cover?

The publishing families are the hits ladder (1+, 2+, 3+ hits), total bases and alternate total bases, hits-plus-runs-plus-RBI combinations, home-run-related markets, and pitcher strikeout ladders. Coverage on any given day depends on whether the provider posts the market, the quote is fresh, and the model finds an edge — the family win rates above show what has actually been published and settled this season.

Why would a prop be excluded from the board?

The most common reasons: the edge over the no-vig consensus is too small to grade, the only available quotes are stale or from books outside the allowlist, the lineup slot or starting pitcher is unconfirmed, or the market fails a runtime quality check. Exclusions are archived as WAIT or PASS decisions with their reasons, so the silence is auditable too.

Is the model's prop record public?

Yes. Settled prop rows are released through the delayed ledger at https://posterior.pro/data with model probability, market reference, and outcome, and the per-family aggregates on this page come from the same public accuracy contract at https://posterior.pro/mlb/accuracy. Live, unplayed rows stay inside Posterior Pro until they settle.

Why do different prop markets need different model heads?

Because the underlying random variables behave differently. Whether a batter gets a hit is a per-at-bat rate problem, which the beta-binomial handles naturally. Strikeout totals are over-dispersed counts — aces have genuinely wider games — which is what the negative binomial's dispersion parameter captures. Total bases depend on the mix of singles versus extra-base hits, so they are convolved outcome by outcome. One shared template would misprice all three.

What does the Brier score next to each family mean?

Brier score is the mean squared error of the model's stated probabilities against actual outcomes — lower is better, and a coin-flip forecaster sits near 0.25. A family can post a decent win rate while scoring poorly if the model was timid on winners or loud on losers, which is exactly the kind of gap the calibration pass is designed to catch.

Posterior is baseball data, not a sportsbook. The public receipt lives at /data, the methodology lives at /methodology, and today's board starts at /today.